
Your POS data already knows which stores are underperforming.The question is whether anyone can see it in time to act.
StoreSense turns transaction-level POS data into role-based dashboards for commercial, finance, and marketing teams, with drill-down from terminal performance to individual store transactions. One set of numbers, cut the way each team actually works.
Turn POS Data into Actionable Retail Insights
Most airports hold more retail data than they use. Sales arrive by store and by month, get summarized into a board pack, and the interesting questions go unasked. Why did duty-free fragrance soften in Terminal 1 but hold in Terminal 2? Is a food court unit's weak month a traffic problem or a basket problem?
Those questions need analysis, not more reporting. StoreSense organizes validated transaction data into dashboards, KPIs, and comparisons your team can interrogate. A commercial manager can start at terminal level, drill into a category, then open a single store's transactions, without waiting on a report.

to Decisions
What Is POS Data Analytics?
POS data analytics is the analysis of point-of-sale transactions to understand what is sold, when, where, at what value, and in what combination. In an airport, every transaction carries commercial context too: which terminal, which concessionaire, which contract, which passenger flow.
That context separates airport POS analytics from general retail analytics. Sales per passenger only means something when transactions can be tied to traffic, and category performance only when duty free, F&B, and specialty retail are each measured on their own terms.
Retail Business Intelligence Built for Airports
Retail BI brings POS, store, passenger, and concessionaire data into a single commercial view. StoreSense builds that view across the estate: retail stores, duty free, food and beverage, real estate, and car park utilization, visible in one place instead of one system per category.
Because the analysis runs on standardized transaction data, comparison holds up. Put two stores in the same category side by side, or measure a brand against the rest of its category, and the underlying numbers were counted the same way.
See how StoreSense turns your POS data into commercial decisions.
Request a DemoKey POS Analytics Capabilities
Sales Performance Analytics
Sales by store, category, terminal, and period, with configurable visualizations exposing trading patterns by hour, day, and season.
Store Performance Analytics
Store-level dashboards covering revenue contribution, transaction counts, and productivity per square meter, which informs space decisions.
Revenue Analytics
Revenue across the estate by concession, category, and terminal, so growth or decline can be traced to a source.
Product and Category Analytics
Performance at category, sub-category, and product level, with product affinity analysis showing which items sell together.
Transaction Analytics
Average transaction value, basket composition, and transaction volume, with drill-down to individual transactions when a figure needs explaining.
Concessionaire Analytics
Brand and concessionaire comparison across stores and terminals, giving airport and retailer a shared view.
Passenger Spending Analysis
Passenger segmentation built from flight and purchase data, showing how traveler profiles differ in spend.
Store and Terminal Benchmarking
Comparison between stores, brands, and terminals on sales per passenger, sales per square meter, and revenue per square meter.
Retail BI Dashboards for Different Teams
Dashboards are role-based, so each team gets the cut of the data it needs rather than one report everyone half-uses.
For Commercial Teams
Revenue, store, concessionaire, and terminal performance in one view, with alerts when a category or store moves outside its expected range. This is the working surface for category reviews, tenant conversations, and space decisions.
For Finance Teams
Revenue visibility grounded in actual transactions, with exportable reports and scheduled email summaries for month-end. Since the same data feeds contract-based income computation, reporting and reconciliation draw on one source.
For Marketing Teams
Passenger behavior and segmentation, product affinity, and campaign performance. Flight profiles can be correlated with spending patterns, which makes it possible to target a promotion at a specific passenger mix instead of the whole terminal.
Airport Retail KPIs You Can Track
| KPI | What it measures | Why it matters |
|---|---|---|
| Sales per passenger | Retail spend divided by passenger traffic for a period, terminal, or category | The core non-aeronautical productivity measure. Isolates commercial performance from traffic growth |
| Sales per square meter | Revenue generated per unit of retail space | Shows whether a unit earns its footprint, and informs space allocation and store sizing |
| Average transaction value | Mean value per transaction | Distinguishes a basket problem from a footfall problem when sales move |
| Transaction volume | Count of transactions by store, category, and time | Reveals conversion and trading peaks against the flight schedule |
| Revenue | Total and concession-level revenue across the estate | The reporting baseline for commercial, financial, and concession management decisions |
| Category performance | Sales, growth, and mix by category and sub-category | Guides category reviews, tenant mix decisions, and promotional focus |
| Store performance | Individual store results against category and terminal peers | Identifies which units need support and which merit expansion |
| Concessionaire performance | A brand or operator's results across all its locations | Grounds contract negotiations and performance reviews in shared evidence |
From POS Data to Retail Intelligence
Monday morning, the commercial dashboard flags that duty-free liquor in Terminal 2 has fallen against the prior four weeks. Transaction analytics shows volume flat and average transaction value down, so footfall is not the cause. Category drill-down puts the decline in premium spirits. Benchmarking against a comparable store in another terminal shows that category holding steady, which points at the store. That is a Monday afternoon conversation with the concessionaire, backed by evidence, instead of a question at the quarterly review.
-
Raw POS Data
-
Processing
-
Analytics
-
Dashboard
-
Insight
-
Action
A dashboard is worth what it shortens: the gap between something changing in your estate and someone acting on it.
AI-Powered Retail Insights
StoreSense applies AI models to transaction and consumer data to surface patterns that are hard to spot by hand: trend analysis, passenger behavior, product affinity, and automated product categorization down to sub-category level. That last one matters more than it sounds. Concessionaires classify their own products inconsistently, and automated categorization is what keeps category reporting comparable across the estate.
These models support decisions rather than make them. They can help identify which passenger segments are worth targeting, which product pairings justify a promotion, and which trends to factor into layout, pricing, and staffing plans. The commercial judgment stays with your team.
Why Choose StoreSense for POS Data Analytics & Retail BI?
StoreSense is airport retail intelligence built on an airport data model. Terminals, concessions, contracts, and passenger flows are first-class dimensions, not custom fields added to a generic BI tool afterward.
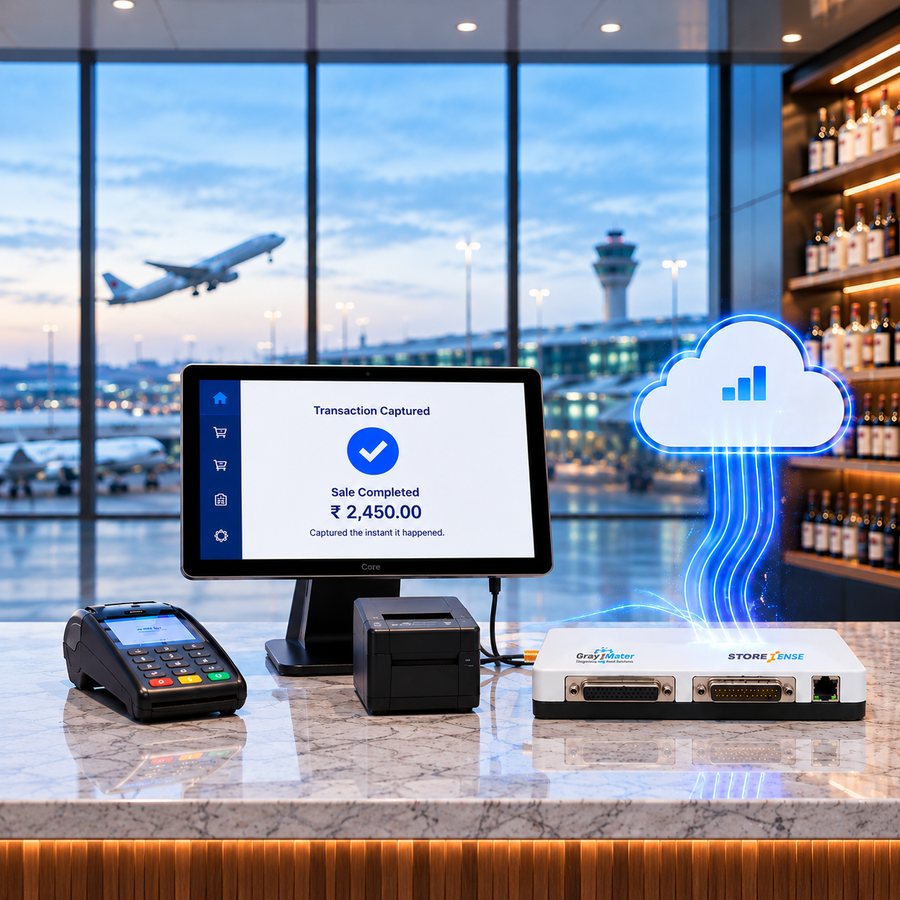
It also runs on a real-time data foundation. Because sales data is captured automatically at the POS, the analysis reflects current trading rather than a submission cycle. Role-based dashboards, transaction-level drill-down, cross-terminal comparison, and threshold alerts come as standard, and the platform scales as concession counts grow.
Frequently Asked Questions
POS data analytics is the analysis of point-of-sale transaction records to understand sales performance in detail: what sold, at which store, at what time, at what value, and alongside which other products. It differs from sales reporting in that the data can be queried and broken down rather than only summarized, so a figure can be traced to the transactions behind it.
Retail business intelligence combines sales, store, passenger, and concessionaire data into dashboards that a commercial team can explore for themselves. A sales report answers one question that someone anticipated. Retail BI lets teams ask follow-up questions without commissioning new work, which is what allows problems to be diagnosed in the same session they are noticed.
It shows performance at a level generic reporting misses: category and sub-category trends, individual store results against terminal peers, transaction values and volumes, and how spend varies with passenger mix. That level of detail is what supports evidence-based category reviews, tenant mix decisions, space allocation, and concessionaire performance conversations.
Sales per passenger and sales per square meter are the two core productivity measures, since they separate commercial performance from traffic growth and from unit size. Average transaction value and transaction volume together explain why a sales number moved. Category, store, and concessionaire performance then localize the cause.
By measuring every operator against standardized transaction data instead of self-reported summaries, and by comparing like with like: the same category, comparable terminal locations, and the same time period. StoreSense enables comparison between brands, stores, and terminals, so both sides can review performance against the same evidence.
Transaction-level data shows where non-aeronautical revenue is actually generated, by category, unit, and terminal. Combined with contract data, it supports income computation and reporting, and helps identify underperformance early enough to address it during the contract term rather than at renewal.
Analytics is only as good as the data underneath it. Automated capture is what makes standardized, transaction-level analysis possible, which is why the two modules are designed together. If sales data currently arrives as monthly spreadsheets, the capture layer is the place to start.